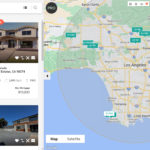
How is your city’s noise pollution? The Department of Transportation has released a
National Noise Map for you to find out. The heat map reveals the medium to loud sounds surrounding 97 percent of the population. The map focuses on airplane and road noise, with views from a national to county level.
Areas that appear in blue to deep purple on the map are considered the noisiest, in which nearby residents are exposed to 80 to 95 decibels regularly. The majority of blue to purple areas are near one of the noisiest offenders: airports or along flight paths.
On the other hand, light yellow and orange areas on the map are the quietest, with transportation noise at about 35 to 40 decibels.
The map breaks down the sound levels, equating it to the noise levels from a refrigerator humming to a garbage disposal.

The Department of Transportation culled data from the Federal Aviation Administration and the Federal Highway Administration to create the map.
View the map here.
Source: Department of Transportation and “National Noise Map Charts Americans’ Aural Misery,” Wired.com (March 24, 2017)